![]()
Unit 1-Functions and Their Graphs
We continue our focus on the definition of a function, how to graph a function, and the relationship of functions and their graphs as we learn to analyze a function in the next section.
Follow this link for a list of Graphing Calculator Skills needed for this chapter.
Section 1.4 Graphs of FunctionsMain Points and Objectives
Domain and Range.
- You should be able to identify the domain and the range from a graph of the function, and for many functions be able to identify the domain and the range from analyzing where the function exits agebraically. The notation used for intervals can be confusing. When discussing domain and range, (a,b) means the interval from a to b but not including the endpoints a or b. This is the same notation use for coordinate points and can be confusing to many students. Please be careful. When the endpoints are included bracket notation is used. [-2,6) means the interval containing all the points from -2 to 6, including 2 but not including 6.
The domain of this relation is [-3,3].
The range is[-2, 2].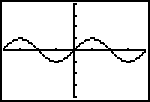
The domain of this function is [-4,4].
The range is [-1, 1].- If it is assumed the the function goes on and on in both directions forever, the domain of the above function becomes (-oo, oo) Note: oo means infinity.
Click on the icon to explore domain graphically
- QUIZ for Domain and Range.
In order to view this quiz and other material later in the course, you will need to download a free version of Adobe Acrobat Reader. Please click here to get the program.Quiz 1
- 1. E-mail, just the solutions and explanations in text. OR
- 2. Fax the quiz back to me.The fax number is posted on the WebBoard
Since a vertical line passes through more than one point, this relation is not a function.
This function appears to be increasing on (-oo,-2) U (1, oo) and decreasing on (-2, 1).
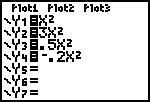
TRY it now!! Use your graphing calculator with a Standard window to find the relative maximum of :
y = -2x3 + 3x -3
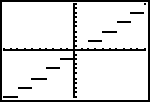
Example of a "step function".
y1 = 2int (.5x)
graphed in "dot mode" .
Section 1.5 Shifting, Reflecting, and Stretching Graphs
This section explores the relation between functions and how their graphs are shifted vertically or horizontally, and stretched. This topic will be explored in further detail as the course progresses but you can explore now with the LiveMath Notebook below.
Section 1.6 Combinations of Functions
- The domain of the combination function is the domain which is common to both.
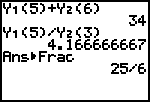
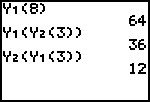
- The graphing calculator can do a numerical composition by using the cut and paste of the y1 and y2 functions found in the Y-VARS menu. Refer to the manual for this or email me for help if you cannot get to these functions on the calculator.
The is the graph of y = x3 and its inverse.
This function is not one-to-one as it does not pass the horizontal line test. It has no inverse.
©Joan Bookbinder 1998 -2002